
Ada County Housing Market, October 2026: What Changed and What It Means for You
Prices up from last year, a quieter month for closings, and a resale shelf that keeps getting thinner.

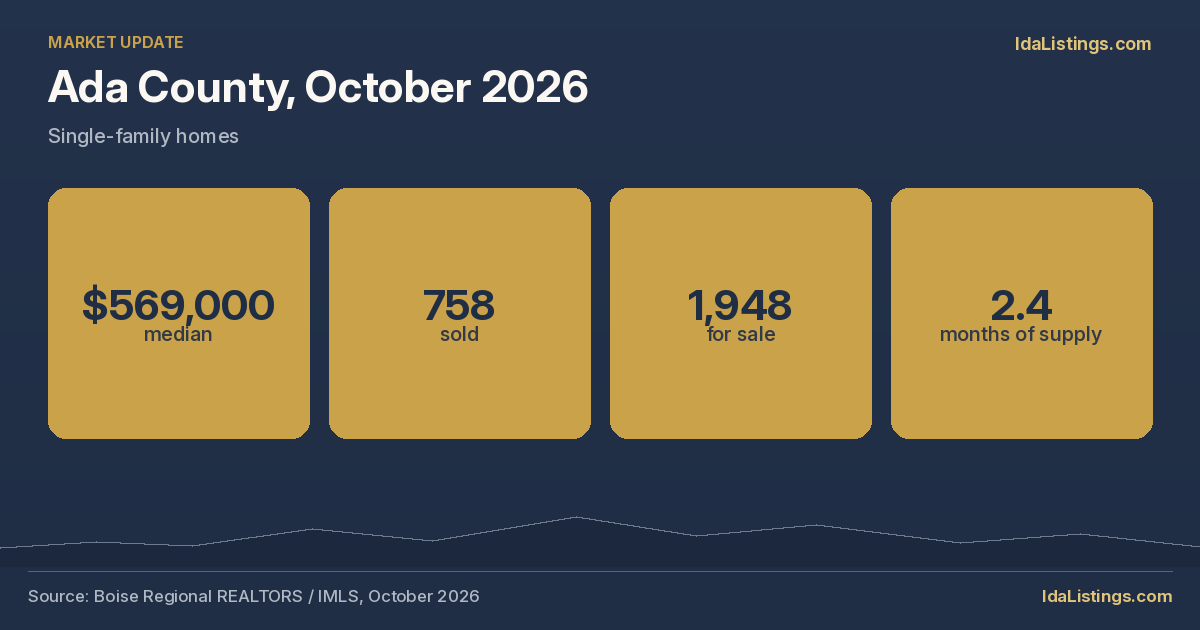
October's numbers are in. The short version: prices are a little higher than a year ago, fewer homes closed, and buyers who want an existing home have fewer to choose from than they did last fall.
Here's what changed, in plain English, using the October 2026 figures for single-family homes in Ada County from Boise Regional REALTORS®, based on Intermountain MLS data.
1. October at a glance
| Metric | Oct 2026 | Sep 2026 | Oct 2025 |
|---|---|---|---|
| Median sales price | $569,000 | $575,000 | $549,900 |
| Closed sales | 758 | 854 | 857 |
| Pending sales (under contract) | 1,062 | 1,140 | 1,018 |
| Homes for sale | 1,948 | 2,006 | 2,125 |
| Months of supply | 2.4 | 2.4 | 2.8 |
Months of supply is how long it would take to sell every home for sale at the recent pace. Around 4 to 6 months is generally considered balanced, so Ada County still leans toward sellers.
A quieter month, but prices are holding and supply is still tight.
2. What changed since September
The median dipped slightly. $569,000, down $6,000 from September's $575,000. One month isn't a trend.
Fewer homes closed. 758 closings, down from 854. That's a normal seasonal slowdown heading into winter.
Fewer homes went under contract. 1,062 pending sales, down from 1,140.
Supply held steady. 1,948 homes for sale and 2.4 months of supply, the same as September.
Fall slowdowns are normal. The steady supply number says the market is cooling with the season, not shifting.
3. What changed since last year
Prices are up modestly. The median rose 3.5%, from $549,900 to $569,000. Year to date, the median is $569,000, up 2.0%.
Fewer homes closed this October. 758, down 11.6% from 857. But year to date, 8,473 homes have sold, up 11.2%.
More homes are under contract. 1,062 pending, up 4.3% from a year ago.
The shelf is thinner. 1,948 homes for sale, down 8.3%. Supply fell from 2.8 months to 2.4.
Homes overall have been averaging about 38 days to go under contract.
*Curious what October's numbers mean for your home? Start with a free property analysis.*
Year-to-date numbers smooth out the month-to-month swings. They're the better guide to direction.
4. Resale and new construction
| Segment | Median price | Closed sales | Homes for sale | Months of supply |
|---|---|---|---|---|
| Existing / resale | $556,000 (up 3.9%) | 512 (down 3.2%) | 892 (down 15.0%) | 1.7 |
| New construction | $590,000 (up 4.2%) | 246 (down 25.0%) | 1,056 (down 1.9%) | 3.7 |
| Townhomes | $427,400 (up 4.4%) | 70 | 227 | n/a |
The resale shelf is the tightest it has been in a while, with 892 homes for sale and about 1.7 months of supply. New construction makes up about 54% of the single-family homes for sale, and buyers are still choosing it: new-build pending sales were up 12.7% from a year ago.
Fewer resale choices, steady new-build choices.
5. What it means if you're buying
1. Talk to a lender first, so you know your real budget.
2. Save a search on the map so new matches come to you.
3. If you're open to new and resale homes, compare total cost, not just the price.
Fewer homes closed in October, but that doesn't mean there's a flood of choice. Resale supply is about 1.7 months, so a well-priced existing home can still move quickly. New construction offers the most room to compare.
The quieter season can work in your favor. There may be fewer buyers touring the same homes as you, and more time to think things through.
Have your own agent with you on your first visit to any new-home community.
6. What it means if you're selling
1. Start with your real number, based on actual MLS sold data.
2. Plan around about 38 days to an accepted offer, plus time to close.
3. If you're thinking about spring, the next few months are a good time to prepare.
Prices are holding compared with last year, and if you own an existing home, your direct competition is about 15% smaller than it was a year ago. That's encouraging.
Buyers are still careful, though, and many will compare your home with new construction. Pricing from what similar homes near you actually sold for, and presenting your home well, carry the most weight. Idaho is a non-disclosure state, so online estimates have to guess. Real sold data matters.
Less resale competition helps, but price and condition still do the heavy lifting.
Looking for homes in Ada County? Search homes on the map
Curious what October's market means for your home? Get my free property analysis.
What does October's market mean for your home?
A free property analysis uses actual MLS sold data near you. I review each one personally, and you'll have it within one business day. No obligation, and no need to list.
Get my free property analysisFrequently Asked Questions
What was the median home price in Ada County in October 2026?
The single-family median sales price was $569,000, up 3.5% from October 2025, according to Boise Regional REALTORS® and Intermountain MLS data.
How many homes are for sale in Ada County?
There were 1,948 single-family homes for sale in October 2026, down 8.3% from a year earlier. That's about 2.4 months of supply.
Is it a buyer's or seller's market in Ada County?
With about 2.4 months of supply, below the 4 to 6 months generally considered balanced, the market still leans toward sellers. Resale is tighter, at about 1.7 months.
Are home prices going down in Ada County?
The October median was down slightly from September but up 3.5% from a year earlier. Year to date, the median is up 2.0%.
Information is deemed reliable but not guaranteed. Market figures are aggregate and for general information only.
Sources
- Market statistics: Boise Regional REALTORS® October 2026 Market Report, Intermountain MLS data as of November 10, 2026 (Ada County single-family, existing/resale, new construction, and townhomes).
Ben Janke, Associate Broker. IdaListings at Silvercreek Realty Group. 1099 S Wells St #200, Meridian, ID 83642. Call or text (208) 991-2127. Market data: Intermountain MLS (IMLS), October 2026. All figures are aggregate summary statistics and do not describe any individual property. Equal Housing Opportunity.